

ANALYSIS
INTERACTION

A SHOW OF NUMBERS
SERVICES
Content strategy
LinkedIn analytics
Data analysis
Campaign design
A year of LinkedIn data.
One clear strategy.
Working in-house at a global tech recruitment firm, we analysed a full year of the company's LinkedIn activity on our own initiative and turned the data into a clear, evidence-based content strategy.
12 — MONTHS OF DATA ANALYSED (full year of the LinkedIn posts’ performance)
3 — CONTENT PILLARS IDENTIFIED (top-performing categories by engagement)
1 — CLEAR STRATEGY DELIVERED (actionable recommendations, ready to implement)
Posting consistently, but not strategically.
The company had an active LinkedIn presence but no clear picture of what was actually working. Posts went out regularly; some performed well, most didn't. Without understanding why, the team was producing content without direction.
The problem wasn't output. It was insight. Nobody had ever analysed the data to find the patterns, which post types drove engagement, which audiences responded to which content, and which high-profile interactions were being missed as amplification opportunities.
The brief was to audit a full year of LinkedIn activity and deliver a clear, actionable content strategy based on the data.
THE CHALLENGE
Data first. Strategy second.
We built a structured analysis framework around one year’s worth of posts, putting them in order from those with the lowest interactions to the highest. Then we could identify patterns that were only visible once the posts were categorised.
Quantitative methods identified which content categories drove the most engagement. A qualitative assessment then revealed the messaging, visual appeal, authenticity and content type for the high-performing posts.
THE APPROACH
01 — Inconsistent engagement with no explanation
Some posts performed significantly better than others, but nobody understood why. The team was guessing what to prioritise rather than knowing.
02 — No content framework
Content was produced ad hoc with no strategic backbone. Without clear pillars or a posting framework, there was no way to build momentum or compound results over time.
03 — Missed amplification opportunities
High-profile interactions, comments and shares from influential accounts were not being identified or leveraged for greater reach. Opportunities were appearing in the data and being ignored.
CONTENT PILLAR IDENTIFICATION
Three top-performing content categories were identified from the data. Each pillar defined what format, what tone and what subject matter drove the strongest engagement.
FULL YEAR DATA AUDIT
Every post’s engagement rate, content type, timing, format and audience response was analysed. We identified patterns that weren't visible from individual posts, but became clear across the full dataset.
INFLUENCER AMPLIFICATION MAPPING
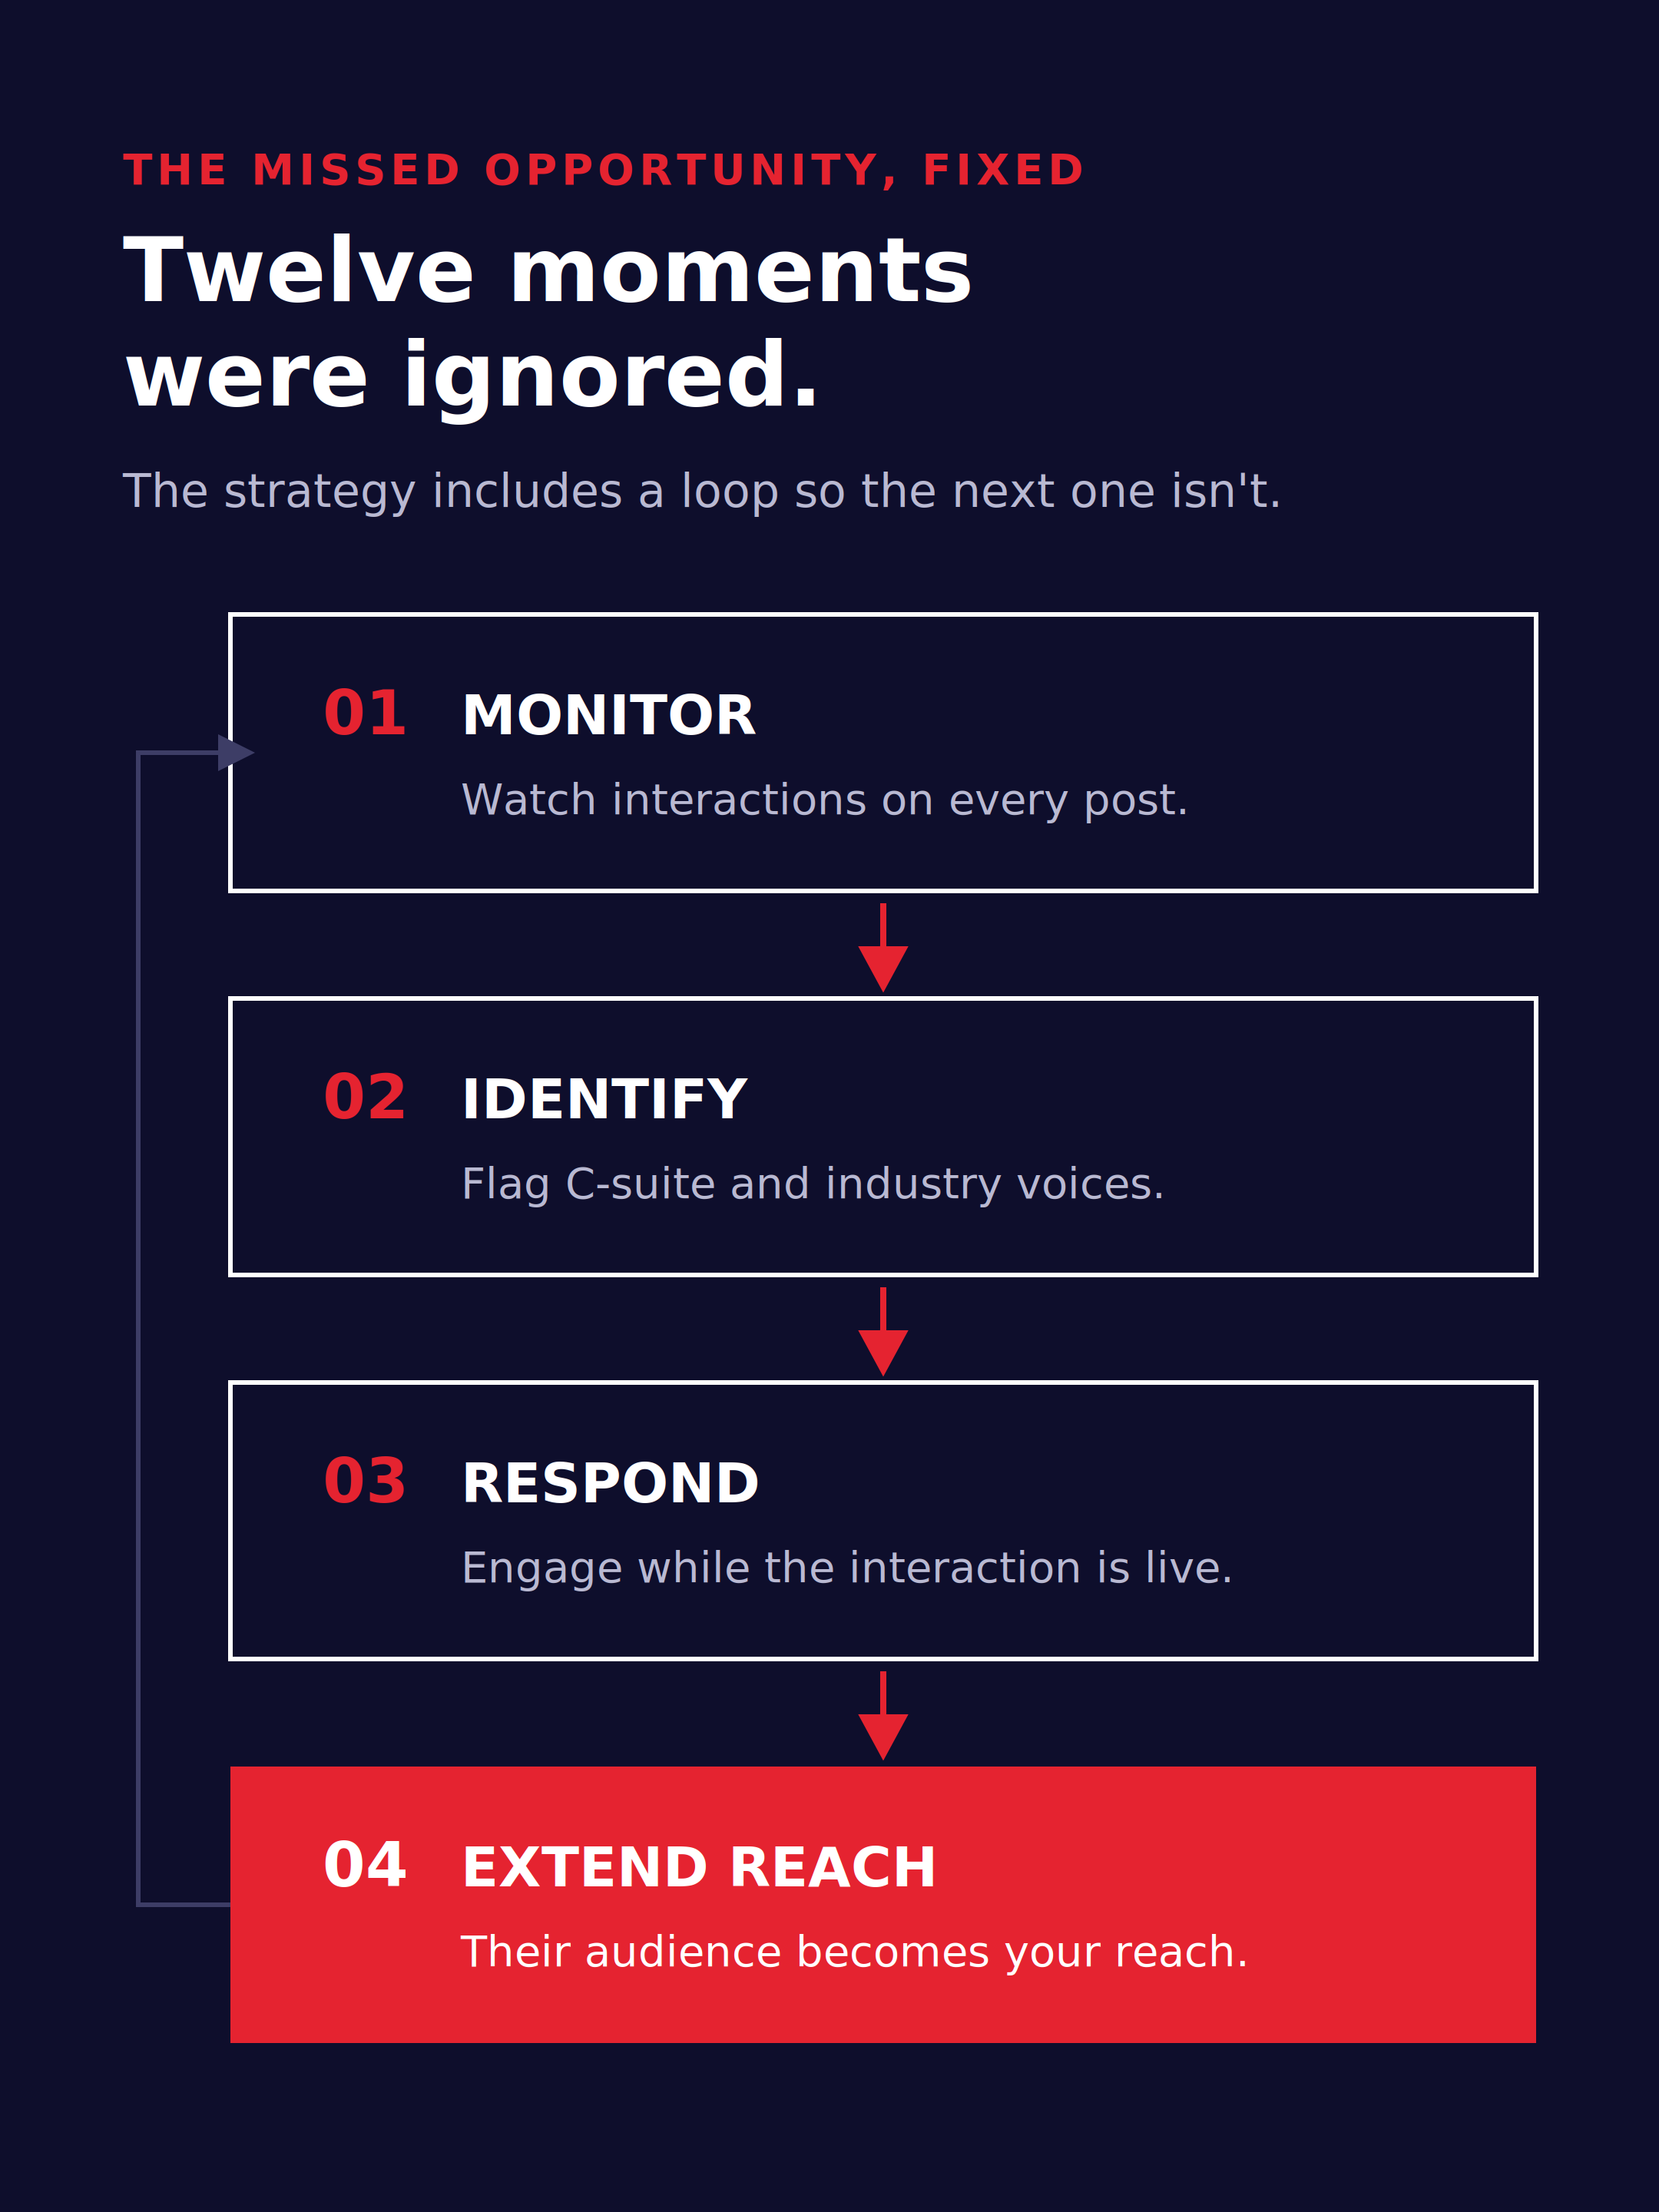
High-profile interactions were identified and flagged. A specific process was recommended to help the client respond to these interactions and leverage them to extend organic reach.
ACTIONABLE DOCUMENT
All findings were delivered to the client in a clear document, not a data dump. We presented specific recommendations with the evidence behind each one. Built to be used, not filed away.
WHAT THE DATA SHOWED
Twelve months of LinkedIn post data, analysed and distilled into three findings that changed how the team approached content production.
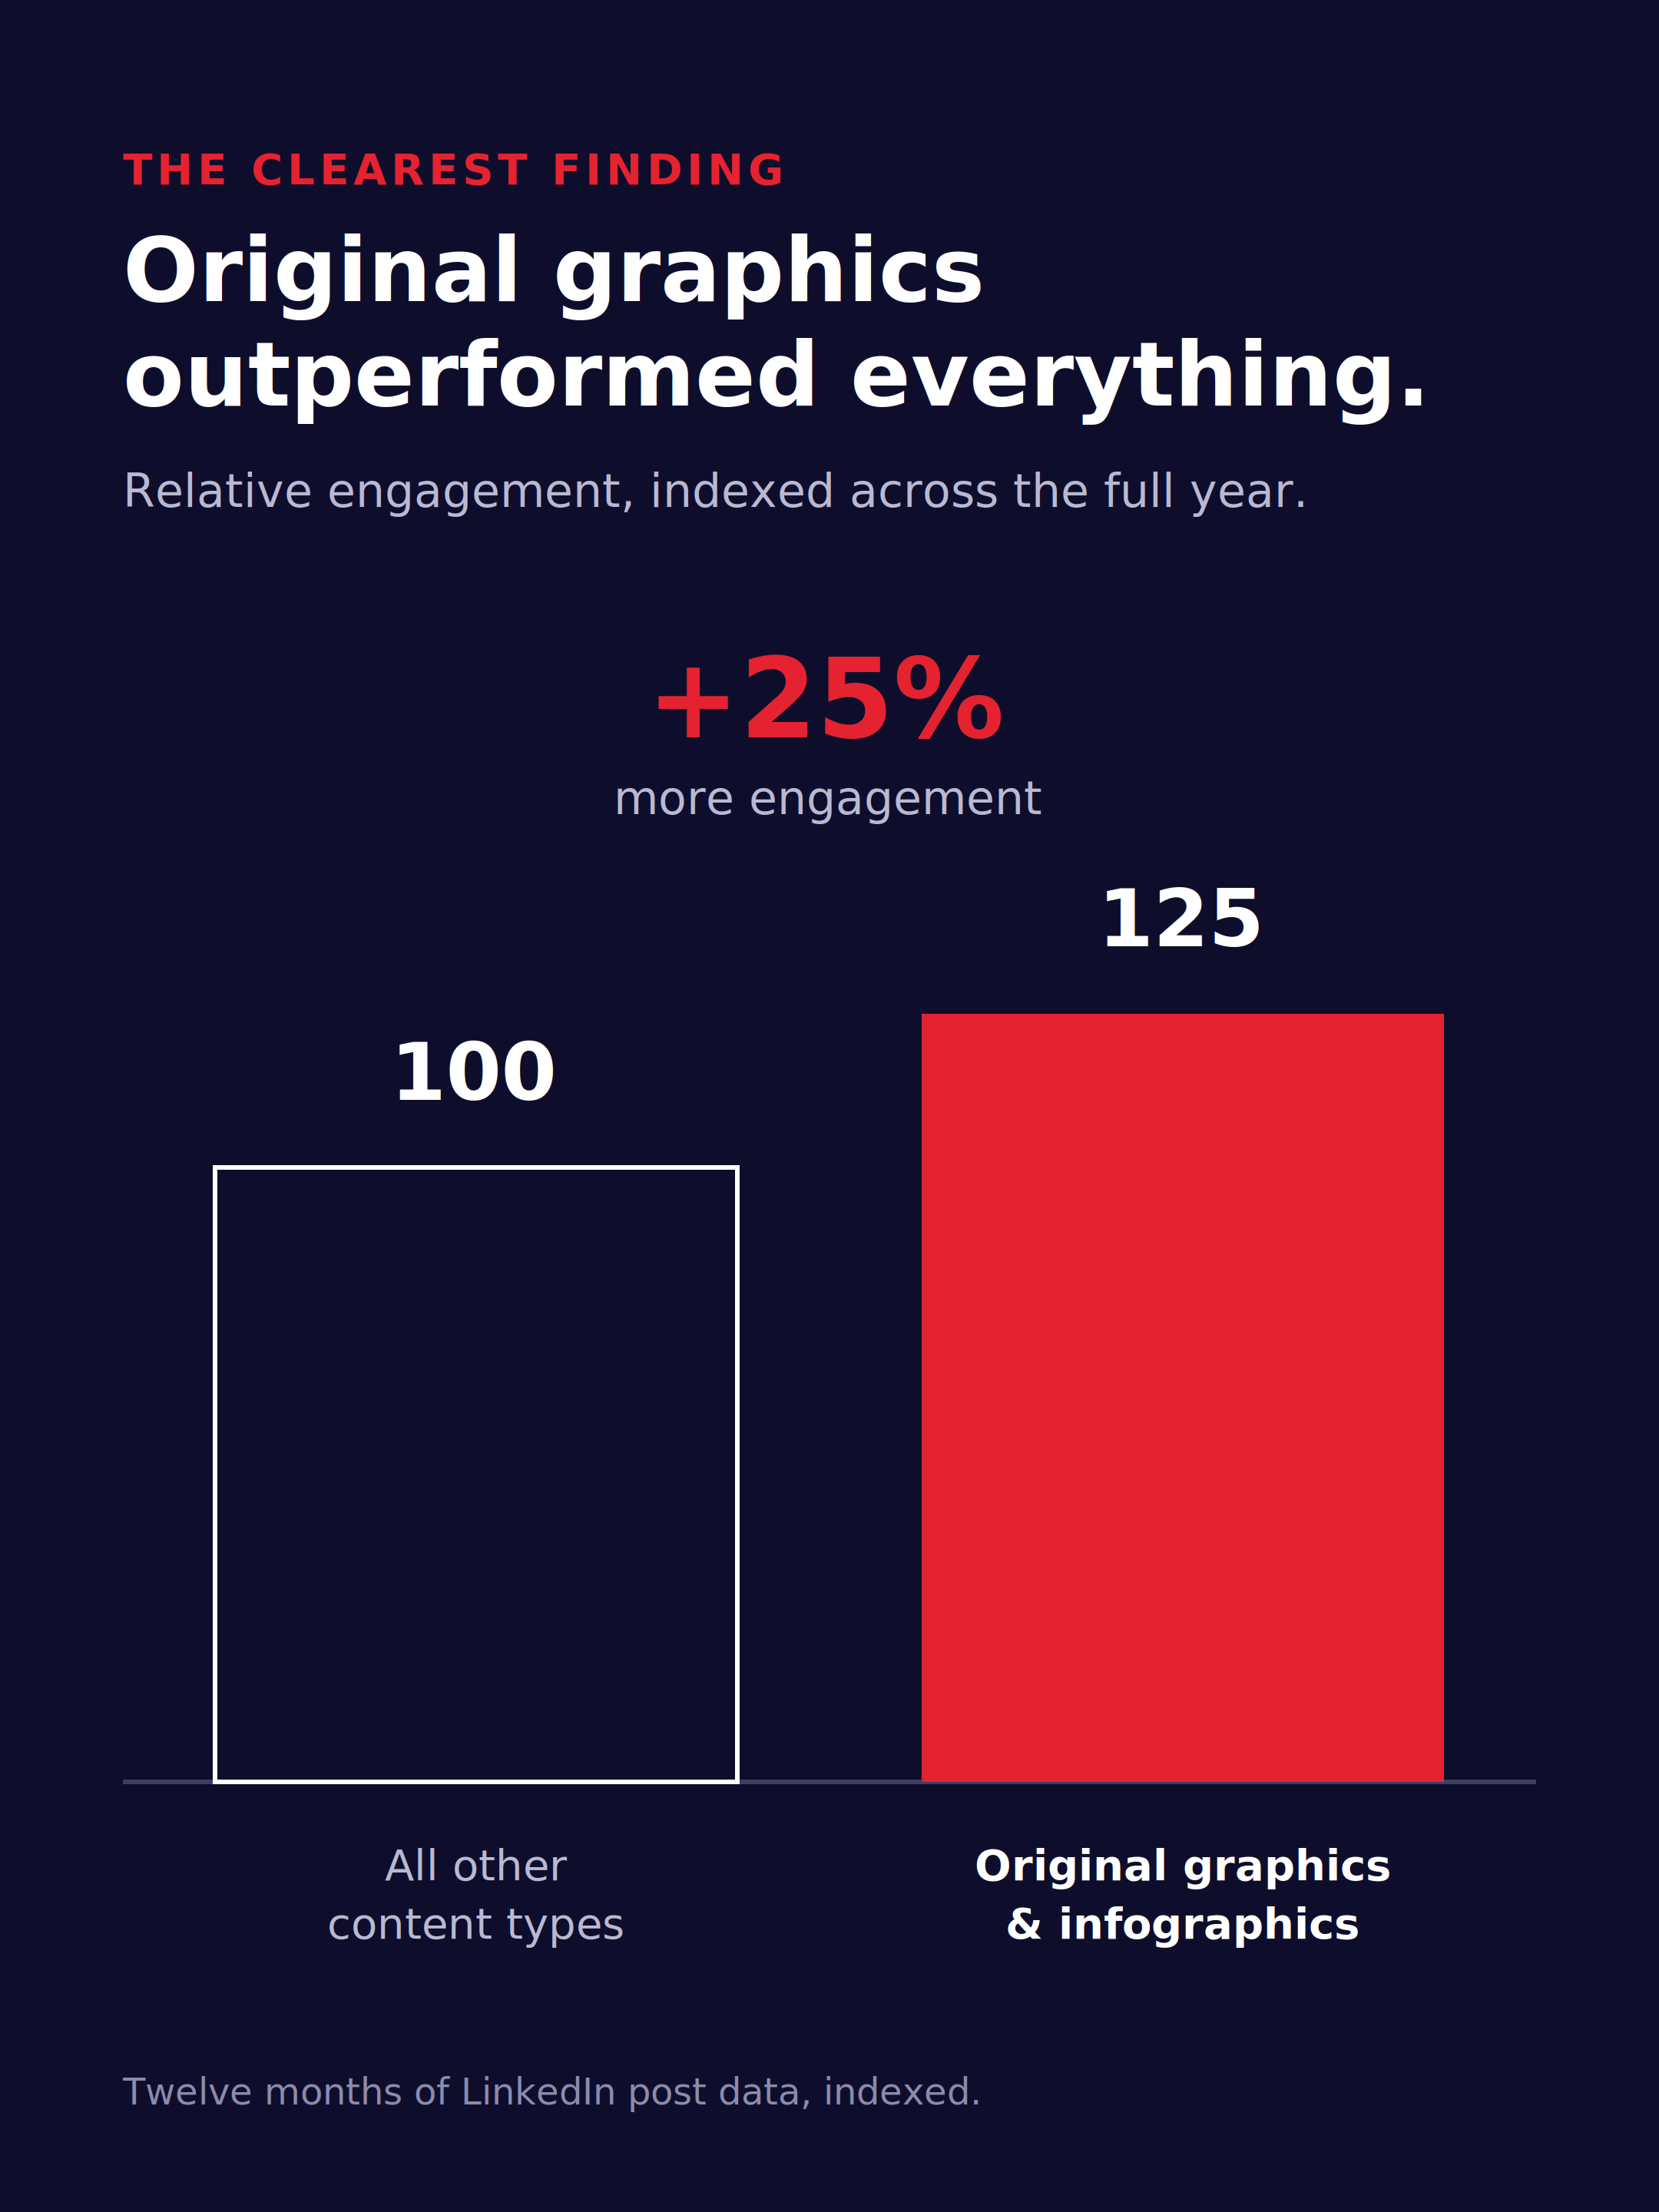
25% More engagement.
Posts featuring original graphics and infographics drove 25% more engagement than other content types. That was the single clearest and most consistent finding across the full year of data.

12 Missed amplification moments
C-suite and industry thought-leader interactions identified in the data were ignored. Each one represented a missed opportunity to extend post reach to a larger, relevant audience.

1 Consistent top-performer.
One content category consistently outperformed all others. Once identified, we took the time to understand it and use it as the foundation of the recommended content strategy.

The analysis was conducted independently in-house. The data screenshots show analytical outputs, but no company name, branding or individual identities are visible.
THE OUTCOME
The analysis was delivered as a complete, evidence-based framework with clear pillars, specific format recommendations, and a process for capitalising on high-value interactions as they happen. A year of guesswork was converted into a strategy anyone could follow straight away.
All data shown is anonymised.


FROM GUESSWORK
TO A CLEAR FRAMEWORK
"Most businesses make content decisions based on instinct. We made them based on evidence. Twelve months of data told us exactly what the audience responded to, and what was being wasted."
The client went from posting without direction to generating engaging content that was based on an evidence-based framework.


Not sure what's holding your marketing back?
Find out why within just two weeks with our Marketing Diagnostic.
No commitment on the first call / Work with our founders / We reply within 24 hours